Google Analytics is an important tool for marketers. It’s used to understand how people come to your website, how different content performs and how to get more conversions. All this is essential for knowing how to drive more high-quality traffic to your website.
For most B2B firms, the main purpose of their website is to generate sales leads by getting visitors to fill in some kind of contact form. But many see that just a fraction of visitors leave their contact information, and as a result, salespeople don’t get enough good quality leads from their website. So what can be done to improve this situation?
This guide will show you the 3 best ways to generate leads with Google Analytics:
1. Using Google Analytics Network report
2. Using a custom Google Analytics report template tool
3. Using Google Analytics with Leadfeeder for lead generation
One way to gain more leads from your website is identifying companies that visit, based on their IP address. With this data, you can have some information about the 98% of visitors that don’t explicitly contact you. When people visit a website using their office network, marketers can identify that someone from a certain company has visited and pinpoint what they have done there. For B2B outbound sales teams, this information can be very valuable.
If you see a company visiting your website, there’s a high probability that they’re in need of- and evaluating your product, which is the perfect time to get in touch with them.
Based on the IP address alone, it’s impossible to know exactly the name of the visitor, but in many cases this information is not needed. For example, if you sell email marketing tools and a company comes to your website and browses product pages, it’s a strong signal they are looking for a new email marketing tool. When you contact them, you want to contact the person who’s responsible for digital marketing, regardless of who visited your website.
For effective lead generation purposes, you should be able to identify real companies that have visited your website and see how they have behaved, to evaluate if they are a good lead.
1. Using Google Analytics Network Report
Using the Network report is the most common way to see which companies have been visiting your website. There have been many blog posts about this topic, for example this LunaMetrics post by Dan Wilkerson from 2012, this how-to article from Anna Lewis and a post by Traian Neacsu on uncovering hidden leads.
But these posts are all now a couple of years old and the Google Analytics interface has changed quite a lot since then. These days (2016) you can find the Network report in Google Analytics under Audience > Technology > Network.
Network report in Google Analytics
In the Network report (seen above) you will see a list of “Service Providers”. What Google Analytics means by “Service Provider” is the network where the visitor has been when they visited your website. Networks are always owned and registered by someone; typically a company, Internet Service Provider or some other organization.
One challenge in using the Network report is that many times the IP is registered by an Internet Service Provider (ISP) or some other non-interesting organization. In order to see the real companies, you should filter out ISPs from the list. The easiest way of doing this is to use the advanced search button and select to exclude Service Providers that match the following RegExp (just copy/paste this to the filter):
(not set|customer|internet|broadband|isp|cable com|network|tele|dsl|subscriber|pool|telecom|cable|addresses|telefonica|routed|leased line|communication|comcast|verizon|road runner|service provider|unknown|provider|t-mobile|wifi|telkom|sprint|at-t|residential|province|vodafone|clients|china|dial-up|netblock|wimax|wireless|elisa|sonera|dna oy|at&t|assigned|sl-cgn|block|consumers|kpn|telia|bredband|google|hosting|zscaler|city of|tdc|hubspot)
Now the list of visiting companies should look a lot cleaner. If you wish to filter the results even further, e.g. only companies from a specific country, you should create a segment out of visitors from that country and look at the report again.
By default for each company in the list you can see how many sessions they have had during the selected time interval, how many pages they have visited and other metrics. When you click on one company, you can get to a more detailed report, like this one below.
In this view, select “Page Title” or “Page” as secondary dimension to know which pages the company has visited. This way you know what they have done on your website and what they were interested in. If they were visiting relevant product pages or they spent a lot to time on your site but didn’t contact you, maybe it’s a good lead for your outbound sales team to contact.
Using Network report to see what company did on the website
If you would really like to know what each company and their employees have done on your website, you can go to the brand new User Explorer report under the Audience section in Google Analytics. This report was introduced in Google Analytics in April 2016 and in the report you can dive into individual visitors and their behavior.
To know what a company did on your website, just create a segment where the Service Provider matches the company you are interested in (see below).
Using User Explorer to see visitors from one company
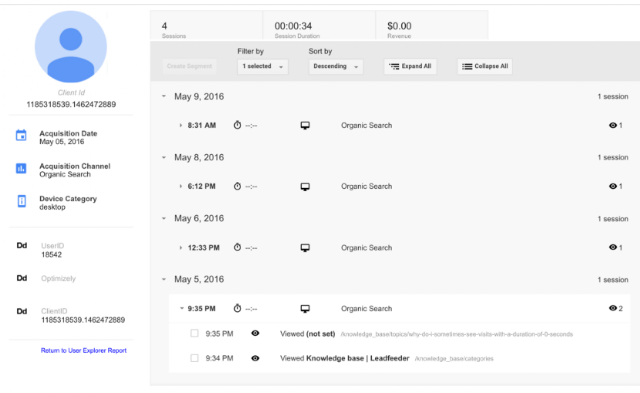
By doing this Google Analytics shows you Client IDs (anonymous and unique IDs of each visitor) from that company and by clicking one client ID (one user) you can see all the behavior of that user on your website. This way you can have a good understanding about what any given person from one specific company did on your website. Pretty powerful stuff, as you can see below.
Using User Explorer to see visits of one user
2. Using a custom Google Analytics report template tool
At Leadfeeder we created a ready-to-use Google Analytics custom report that anyone can take into use for free. Just click the link below and attach it as a custom report to the Google Analytics View you typically use:
https://analytics.google.com/analytics/web/template?uid=zAQeJwWfT0yxlk8wfPWaGA
When you click this link, you will be directed to Google Analytics and asked which view you want to attach it to. Remember that by default this custom report will be visible only for you. If other users want to use this report, they should also click the Add to Dashboard link above.
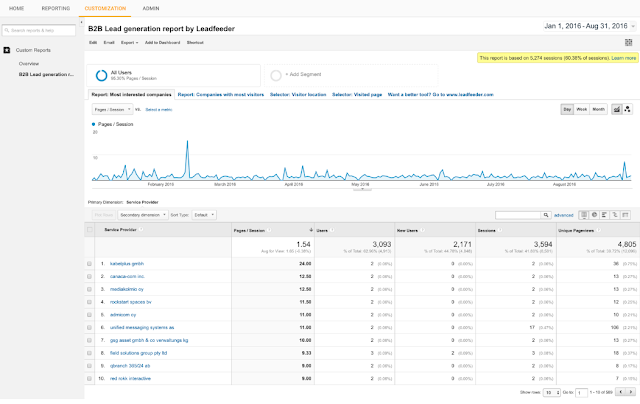
B2B Lead generation report by Leadfeeder
Our custom tool by default shows the most interested companies that have visited your website. To be more precise, this is a list of companies after ISP filtering (using the filter pasted above) sorted by pages / session, with the most interesting visits on top.
Typically companies that have spent a lot of time and loaded many pages are more interested than companies with many short visits. Once you click an interesting company, you can see a list of days on which they have visited. When you click even further into a specific date, you can see a breakdown of all the pages they visited. If page titles are not descriptive enough or not set, you can use “Page” as a secondary dimension to see page URLs (as shows below).
Using B2B Lead generation report by Leadfeeder
In the tool you can see several tabs that you can use (see above). The most interested companies tab is selected by default, but you can also select the second tab – companies with most visitors – that shows companies that have most visits on your website. Many times here you can find ISPs that were not filtered out along with other non-interesting companies. If you like, you can drill into details in the same way as in the first tab.
The 3rd and 4th tabs in the report are selectors that you can use to filter data. For example, if you are only interested in German companies, go to “Selector: Visitor location” tab and select Germany. After that click to the first tab to see the most interested companies from Germany. If you have a sales representative located in Germany searching for German leads, you can automatically have Google Analytics send this lead list by daily or weekly email.
Automating notifications from B2B Lead generation tool by Leadfeeder
Similarly, if your sales team’s responsibilities are divided by product, then sales reps might only be interested in leads that have visited certain product pages. Go to “Selector: Visited page” tab and select the product page each sales rep is interested in. Again, after making the selection, go to the first tab to see the list of the most interested companies visiting that product page and automate lead reports to your sales rep’s mailbox. You can also combine these selectors to create a list of companies from a specific country that have visited a specific product page.
3. Using Google Analytics with Leadfeeder for lead generation
Using the Google Analytics user interface for lead generation is possible as you can see, but not very salesperson-friendly.
In order to better generate leads from your website for your sales department and do much much more, we created an online tool called Leadfeeder. Since Google Analytics is already collecting all the data about your website visitors, Leadfeeder fetches this data from Google Analytics API and does all the data crunching for you.
Leadfeeder lead generation main report
Once you sign up to Leadfeeder, it fetches all visitor data from your Google Analytics for the past 30 days. You don’t need to install any codes or script on your website; all you need to do is permit Leadfeeder to access your Google Analytics.
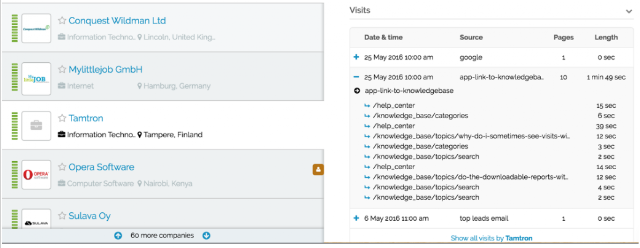
The web app filters out ISPs (a lot more than the Google Analytics filters shown in this post) handing you a clean list of companies. Once you see an interesting company and click on it, you see visit-by-visit, page-by-page what they have done on your website (as shown below). Leads are also enriched with additional company information such as company branch and size. With all this information it’s easier to determine whether the lead is interesting and whether they should be contacted.
Leadfeeder showing which pages a company has visited
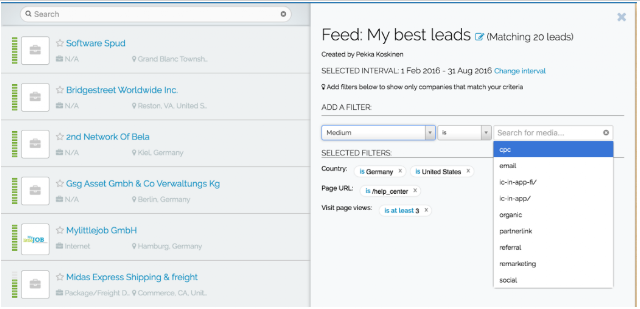
Not all website visitors are interesting, so you can use custom feeds to filter out bounces and view only companies that have behaved in a way you find interesting. For example, you can define a custom feed rule to only show companies from a certain country, from a specific industry, companies that have visited a set number of pages and have visited a specific page but haven’t contacted you.
Using this kind of custom feed you can get a much more relevant list of leads for your sales team. In many companies sales responsibilities are divided by region or product so it’s good practice to make custom feeds for individual sales reps for only their areas of responsibility. Salespeople can subscribe to their personal custom feed to get daily or weekly email notifications about new companies that visit their website and match the set criteria. Understanding the online behaviour of your website visitors combined with knowing the location of the company visit gives sales reps powerful weapons for successful follow-up.
Using custom feeds in Leadfeeder to filter lead list
Seeing a qualified list of interested companies is already powerful, but this sales intelligence should fit within your existing sales process to be really useful. We know it’s the dream of many sales reps to have good leads magically appear in their CRM without the need to do anything, so that’s why at Leadfeeder we have built integrations to sync visitor data with your CRM.
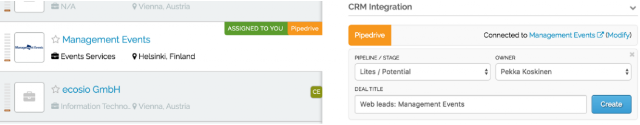
The integration to Pipedrive and WebCRM are made two-way, which means that in Leadfeeder you can see CRM data for the visiting company, while in your CRM you can see all the website visits the company has made, once it’s been connected.
This makes it easier for sales reps to distinguish between new and old clients in Leadfeeder, create accounts and opportunities in their CRM with one click from Leadfeeder, and see in their CRM how prospects are interacting with their website.
Using CRM integration to sending leads from Leadfeeder to CRM
If you are not using a CRM at all, leads can also be sent to sales reps by email or you can assign leads for them to see inside Leadfeeder. It’s good practice to invite the whole sales team to use Leadfeeder with their own user profiles and it’s free to add users.
In addition, if you are using Mailchimp for email marketing, you can connect it to Leadfeeder to see in Leadfeeder what individuals do on your website when they click through from one of your MailChimp campaigns. This is possible because Mailchimp tags links uniquely for all recipients and Leadfeeder can transform these unique links into email addresses. This way you can know exactly who the visitor was on your website.
Leadfeeder offers a free 30-day trial with no credit card required, so if you are in B2B business and would like to get more sales leads, go and sign up at www.leadfeeder.com.
Conclusions
Web analytics has made marketing a lot more intelligent during the last 10 years, but similar development hasn’t transferred to sales.
Web analytics has enabled email tools to evolve into marketing automation by tracking what email clickers do on your website and triggering follow-up emails. Display marketing, similarly, has evolved into very efficient remarketing, where ads are shown to those who have completed action on your website.
In short, there are a lot of digital signals potential customers are giving all the time, but those haven’t been utilized well in sales so far. Many sales reps come to work, open their CRM and start calling through a lead list someone has given them. Meanwhile there are lots of potential customers browsing their website but sales reps aren’t aware of who they are. Our aim at Leadfeeder is to make sales more intelligent by providing salespeople actionable web analytics intelligence about potential customers, thereby making sales more effective.
Posted by Pekka Koskinen, Google Analytics Certified Partner