Stay keen and start to Screen
September 3rd, 2010 | Published in Google Finance
- From the left hand navigation bar on the homepage, or
- From a company page. Scroll down to ‘Key stats and ratios’ along the right hand side and click the ‘Screen stocks with similar metrics’ link. This will automatically fetch companies with similar P/E Ratios and Returns on Equity (TTM) (%)
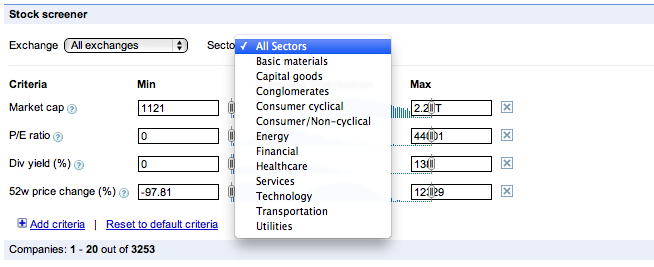
First, you can specify by the Exchange and/or Sector that you want, before narrowing down the financial metrics.

Don’t be afraid to ‘Add criteria’
Why stop at Market cap or P/E Ratio? The Google Finance Stock Screener is a comprehensive tool that lets you add valuation ratios, operating metrics, margins and many more. Simply click
 and choose from a variety of metrics including operating and stock metrics, price, margins, and growth. You can set a minimum and maximum for each metric or use the sliders to set your range. The Company Distribution shows you the relative frequency of stocks for the criterion but please note that this graph is a visual aid, not an analytic tool.
What about dividends? Perhaps you’re looking for a company that will only return a dividend next quarter. Select Div next quarter and the Screener will let you select a forecast value of the next quarterly dividend, per share, to be paid.
If you’re not sure what some of the criteria are, just click on them and a definition will appear in the Add Criteria wizard, as well as a help icon next to each line. And remember the search is live -- no buttons to press. As you make changes to your Screener criteria, the companies will update automatically!
Try these tips out and let us know what you think or submit your Stock Screener suggestions on our Product Ideas page. Stay tuned for more as we keep adding new features to Google Finance. To catch the latest from the Google Finance team you can follow us on Twitter.