Using Google Docs as a data mashup platform
February 26th, 2010 | Published in Google Docs
Guest post: Tony Hirst is a lecturer in the Department of Communication and Systems at the UK's Open University, co-founder of document discussion platform WriteToReply.org and member of the JISC's DevCSI Developer Focus Group. An aspiring "mashup artist", he blogs regularly at OUseful.info.
For several years, I have been exploring various ways of using online applications to grab and display data from around the web and represent it in a visual form. One fertile source of near-live data, particularly for sports results, is Wikipedia; but how can you get data out of Wikipedia and then display it in a chart, or on a map?

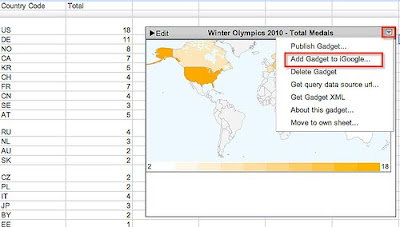
For the 2008 Olympics, I looked at how to create a map-based view of the overall medal tables using Google spreadsheets. With the Olympics coming round again - this time the 2010 Winter Olympics - I thought I'd take the opportunity to update that original mashup with a few tricks I've learned since then. In part as a teaching example, I came up with a recipe that illustrates a lot of functionality many people are unaware of, in a self-contained and hopefully coherent way - how to import data into a spreadsheet, how to write an application script, and how to use a spreadsheet as a database. The aim is to create a heat map of the current state of the medals table for the 2010 Winter Olympics that I can add to iGoogle.
The recipe runs as follows:
- Take one Winter Olympics Medal table on Wikipedia
- Use the importHTML function to import the table into a Google spreadsheet
- Filter out the name of each country from the imported table using either a Google Apps script function containing a regular expression or a SPLIT() formula; return the country name to the medal table spreadsheet
- Take one ISO country code table, found via a web search, and copy and paste it into a second spreadsheet worksheet. You will use this sheet as a database
- Using a =QUERY() formula applied to the ISO country code sheet, find the ISO country code for each country in the medal table. (Note that some extraneous space characters in the SPLIT country name require the trailing space to be recognized)
- Arrange the columns, by copying cells if necessary, so that you have a column of ISO country codes followed by number of medals. For example, ISO country code, number of gold medals, ISO country code, number of silver medals, and so on.
- Highlight a country code column and a medal tally column that are side by side, select a heatmap widget from the tools menu and configure it as required
- Embed your Winter Olympics 2010 Live Medals Table Heatmap in your blog or iGoogle from the Gadget menu.

As the Wikipedia medals table is updated, your medals table heatmap should be too. To preview the spreadsheet, please visit here.
A complete recipe is given in the OUseful.info blog post "Creating a Winter Olympics 2010 Medal Map In Google Spreadsheets."
For several years, I have been exploring various ways of using online applications to grab and display data from around the web and represent it in a visual form. One fertile source of near-live data, particularly for sports results, is Wikipedia; but how can you get data out of Wikipedia and then display it in a chart, or on a map?

For the 2008 Olympics, I looked at how to create a map-based view of the overall medal tables using Google spreadsheets. With the Olympics coming round again - this time the 2010 Winter Olympics - I thought I'd take the opportunity to update that original mashup with a few tricks I've learned since then. In part as a teaching example, I came up with a recipe that illustrates a lot of functionality many people are unaware of, in a self-contained and hopefully coherent way - how to import data into a spreadsheet, how to write an application script, and how to use a spreadsheet as a database. The aim is to create a heat map of the current state of the medals table for the 2010 Winter Olympics that I can add to iGoogle.
The recipe runs as follows:
- Take one Winter Olympics Medal table on Wikipedia
- Use the importHTML function to import the table into a Google spreadsheet
- Filter out the name of each country from the imported table using either a Google Apps script function containing a regular expression or a SPLIT() formula; return the country name to the medal table spreadsheet
- Take one ISO country code table, found via a web search, and copy and paste it into a second spreadsheet worksheet. You will use this sheet as a database
- Using a =QUERY() formula applied to the ISO country code sheet, find the ISO country code for each country in the medal table. (Note that some extraneous space characters in the SPLIT country name require the trailing space to be recognized)
- Arrange the columns, by copying cells if necessary, so that you have a column of ISO country codes followed by number of medals. For example, ISO country code, number of gold medals, ISO country code, number of silver medals, and so on.
- Highlight a country code column and a medal tally column that are side by side, select a heatmap widget from the tools menu and configure it as required
- Embed your Winter Olympics 2010 Live Medals Table Heatmap in your blog or iGoogle from the Gadget menu.

As the Wikipedia medals table is updated, your medals table heatmap should be too. To preview the spreadsheet, please visit here.
A complete recipe is given in the OUseful.info blog post "Creating a Winter Olympics 2010 Medal Map In Google Spreadsheets."