Website Optimiser – Identifying high value pages to test
February 27th, 2009 | Published in Google Conversions

For all these reasons, landing pages present a great opportunity for web optimisation. If you can make your landing pages clearer and more compelling, more visitors will stay on your site and go on to buy / enquire with you. The traffic you're working hard to drive to your site will be more likely to convert, meaning more profit for your business (at no extra cost).
You can identify your highest traffic landing pages easily using Google Analytics. To do so, click on the 'Top Landing Pages' (see image below) report within the Content section of your account. This report will enable you to identify high traffic landing pages which also have a high bounce rate and thus are ripe for optimisation.

Other high value pages to test are those contained within a path leading to a funnel conversion goal. A 'funnel' is a series of pages through which a visitor must pass before reaching the conversion goal. The purpose of tracking these pages is to see how efficiently your pages direct visitors to your goal. If you identify any pages within a funnel which have a high drop off rate, then these should be seen as a priority to optimise, as they are restricting the amount of users reaching the conversion goal.
For example, let's say you want users on your company's site to submit an application form. Each step leading up to application submission is a step in the conversion funnel, with the 'Thank you for submitting' page as the final goal page. You'd like to improve conversions and you're wondering about your site content. Could the application form contain too many fields for customers to fill in, or could the information required from customers be difficult for them to locate? Factors like this could deter visitors from completing your form. But what if you could identify which page of your conversion funnel had the highest bounce / drop off rate? You would then know that this was a great page to make changes to and test in order to increase the number of conversions on the site.
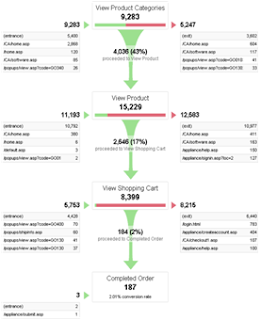
In Google Analytics, you can specify up to ten pages in a defined funnel and these represent the path that you expect visitors to take on their way to the goal page. Once you have created a funnel within Google Analytics, you can view the 'Funnel Visualisation' report located in the Goals section of your account. This report shows you how many visitors exit the funnel at each step in the path towards the goal page.
In the funnel visualisation below, we've taken another example: a retailer who wants visitors to their site to buy from them. You can see that most visitors in this funnel are lost in the final transition from the 'View Shopping Cart' step to the 'Completed Order'. Only 2% of visitors move past this step to actually complete an order, so this would be an ideal page to start testing in order to greatly improve results.

The Google Analytics Funnel Visualisation report (Goals Section) shows the pages where visitors drop out of the funnel path. Pages that lose a high percentage of traffic on the path towards a website goal are good candidates for optimization.