Google Domestic Trends: tracking economic sectors
September 3rd, 2009 | Published in Google Blog
Today, we're really pleased to launch Google Domestic Trends on Google Finance.
Google Domestic Trends tracks Google search traffic across specific sectors of the economy. The changes in the search volume of a given sector on google.com may provide useful economic insight. We've created 23 indexes that track the major economic sectors, such as retail, auto and unemployment.
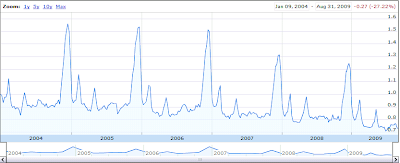
For example, the Google Luxuries Index tracks queries like [jewelry], [rings], [diamond], [ring], [jewelers], [tiffany] and so forth. As you can see from the screenshot below, this index has seasonal spikes in December — however, in the last two years there has been a pronounced decrease as the recession made consumers wary of spending on luxury items.

The Auto-Buyers Index is also interesting, especially the dramatic 40% increase correlated with the launch of the Cash for Clunkers program in the U.S.:

These charts let you easily compare actual stocks and market indexes to Google Trends. And the data for these indexes are available for download — so you can use it with your own models.
Read more about this on the Google Finance Blog, and be sure to check out the Google Research Blog for info on Hal's research on using Google Trends data to predict economic activities.
Google Domestic Trends tracks Google search traffic across specific sectors of the economy. The changes in the search volume of a given sector on google.com may provide useful economic insight. We've created 23 indexes that track the major economic sectors, such as retail, auto and unemployment.
For example, the Google Luxuries Index tracks queries like [jewelry], [rings], [diamond], [ring], [jewelers], [tiffany] and so forth. As you can see from the screenshot below, this index has seasonal spikes in December — however, in the last two years there has been a pronounced decrease as the recession made consumers wary of spending on luxury items.
The Auto-Buyers Index is also interesting, especially the dramatic 40% increase correlated with the launch of the Cash for Clunkers program in the U.S.:

These charts let you easily compare actual stocks and market indexes to Google Trends. And the data for these indexes are available for download — so you can use it with your own models.
Read more about this on the Google Finance Blog, and be sure to check out the Google Research Blog for info on Hal's research on using Google Trends data to predict economic activities.