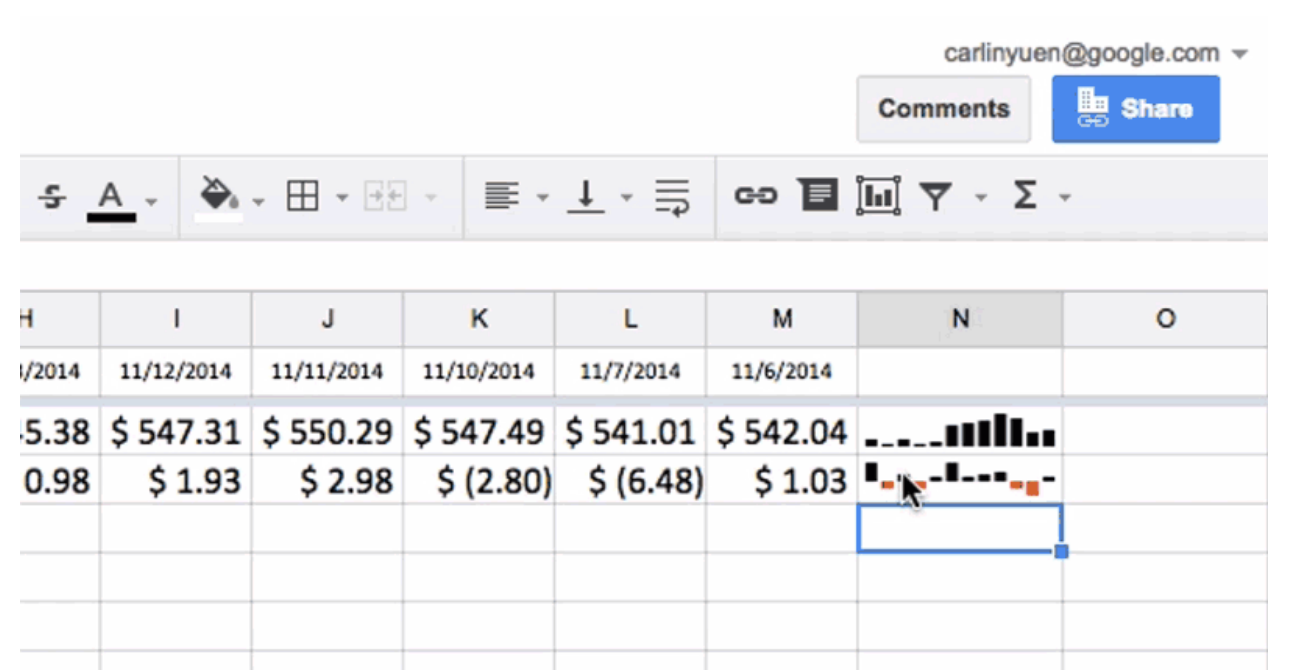
New sparkline options in Google Sheets
December 9th, 2014 | Published in Google Apps
The SPARKLINE function in Google Sheets creates a miniature chart contained within a single cell, providing a quick visual depiction of data trends. With this launch, we’re adding two new types of sparklines - column and winloss - joining the existing line graph and bar chart options:

See the Help Center for details on using the SPARKLINE function.
Release track:
Rapid release and Scheduled release
For more information:
Drive G+ post
Help Center
Note: all launches are applicable to all Google Apps editions unless otherwise noted
whatsnew.googleapps.com
Get these product update alerts by email
Subscribe to the RSS feed of these updates