Using Website Optimizer with Google Analytics – Case Study with Catalogs.com
October 27th, 2009 | Published in Google Analytics, Google Website Optimizer
The following is a guest post from Julie Ferrara-Brown, Director of Quantitative Analysis for WebShare. WebShare is one of our Website Optimizer Authorized Consultants. The case focuses on exploring more than just a single conversion.
Often, optimizing a site means more than optimizing for a single conversion. Understanding how your test pages and sections affect bounce rate, ecommerce revenue, time on site, and all the other metrics provided by Google Analytics can be even more useful than a single conversion rate in painting a picture of how your site is used.
Good news! You can use Google Website Optimizer and Google Analytics together to open up a whole new world of optimization and testing for your site.
A Single Conversion is Not Enough
Catalogs.com worked with WebShare, a Google Analytics & Website Optimizer Authorized Consultancy, to plan and run a test that integrated both tools to collect and analyze a wealth of data. With a number of different monetization paths, the Catalogs.com website wanted to know not only whether alternative versions increase overall conversions, but also what impact would these versions have on specific types of conversions and the revenue associated with them.
During this test, while Website Optimizer as a standalone tool was able to show that overall conversions had increased by 6.8%, the integration with Google Analytics showed much more granular and relevant improvements:
- Specifically, catalog orders rose by almost 11%
- Total revenue from all conversion types was up 7.4%
“It’s great to know that the changes we tested gave us an increase in our overall conversions, but all of our different conversion actions are not equal in terms of the revenue they bring in,” explains Matt Craine of Catalogs.com. “It’s possible that the increase in overall conversion rate could actually lose us money because it was due to a design enticing visitors toward a low value conversion at the expense of our higher value actions.”
Setting up the Test
The aim of this experiment was to test different layouts across all of the sites’ merchant pages. The experiment was set up as a single variable, four-state MVT, encompassing every one of these merchant pages.
Three variations were created, and each merchant page was available in one of its three formats by using different file extensions (.alpha, .beta, and .gamma). The test variable was actually just a piece of script that controlled which version of merchant pages a visitor would see.
Running the Analysis – Website Optimizer
Over the course of a few weeks, almost 70,000 unique visitors participated in the experiment and performed almost 30,000 overall conversion actions. We could see in the Website Optimizer experiment reports that we had found a winner in the Beta version:

This, however, simply told us that Beta was more likely to result in a conversion, regardless of type or associated revenue. Enter Google Analytics.
Getting Additional Data From Google Analytics
In this case, the easiest way to see the Google Analytics data for each variation is by using Advanced Segments. Since each template had its own extension, we can create an advanced segment that matches the “Page” dimension with a specific extension. The result is that the segment will only include data for sessions that included a pageview on one or more pages that matched that condition. Below is an example for the Alpha variation:

After creating a segment for each of the variations, it’s simply a matter of applying those segments to any report in Google Analytics and setting the appropriate date range. Now we can see, side-by-side, data for all the variations in any of Google Analytics’ reports.
Running the Numbers
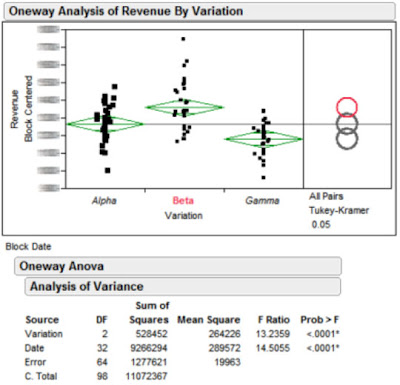
As an analytics platform (and not a testing platform), Google Analytics was not designed to perform the necessary statistical analysis to evaluate this data, but with the numbers it provides, you can perform an enormous amount of offline analysis. Let’s take the case of the bottom line, be-all, end-all metric: Total Revenue.
For all the statisticians out there, in this particular case an F test blocked by day was performed to compare means. The results can be seen in the following analysis.

What this boils down to is that circles that do not overlap or barely overlap represent a significant difference, and in this case the Beta variation is statistically our best variation in terms of generating revenue.
Why Look at Lots of Metrics?
Although we’ve only shown revenue analysis here, it’s important to note that performing this kind of analysis on a number of different metrics can really help you understand your visitors and their experience.
For example, during this test we also found that the Beta version (the version that provided more conversions, more high value conversions, and more revenue) also had the worst bounce rate!
Just because a visitor doesn't leave a site from the first page they land on does not mean they are going to convert.
Get Integrated!
Depending upon your test type and implementation, there are a number of different ways to integrate Website Optimizer experiments with Google Analytics, and hopefully this post has helped to demonstrate the power of having all that wonderful data available in your testing.
“Looking at a puzzle piece by itself is a good way to start toward a solution, but it doesn’t tell you the full story,” says Catalogs.com owner Leslie Linevsky. “Putting all those pieces together shows me how small changes are impacting my business as a whole.”
Thanks to WebShare and Catalogs.com for sharing this case study.