The Value Of Landing Pages
August 31st, 2009 | Published in Google Analytics
Imagine that we're launching a brand new advertising campaign for our new e-commerce website that sells Empanadas, my favorite food. The structure of the website is simple. We have a homepage, a few category pages that lists empanadas by type (baked, fried, etc), and hundreds of individual pages for each type of empanada (ham and cheese, steak, chicken, veggie, etc.).
 (click to enlarge)
Step 1) Create the Custom Report
Go to Custom Reporting and create the following report:
Dimension: Landing Page
Metrics: Entrances, Abandonment Rate, Goal Completed and Value per visitor
 (click to enlarge)
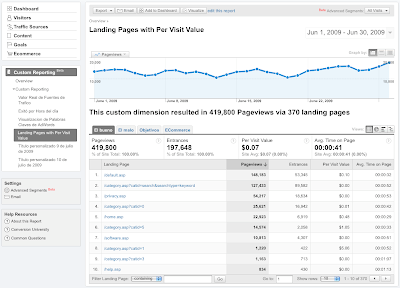
Great. Now I know the average value for any visitor that starts on these pages. On average the value per landing pages is $0.07. This means for all people who arrive at my webpage, on average each person will buy $0.07 worth of empanadas. Not much huh? However, as you can see some pages have a consistently much better conversion rate than others. For example, my home page -- /home.html -- gives me a per visit value of $0.10. I'd like to compare that with my other two page types: product and categories. We could go through this list and pick out one by one which is better, or write a regular expression in the search filter box, but an easier and more flexible way to identify these page is via Advanced Segments.
Step 2) Create the Advanced Segment
Take a minute to think about the layout of your website. Is there a unique identifier that let's you segment your landing page types? If there isn't then ask your Webmaster what you can do to get around this problem. In our example, remember that our website is very simple. Every empanada page contains the word empanada.html, every category page contains category.html, and the home page is home.html. To begin with, let's create a category segment.
Ouch! Visitors that land on my category pages spend an average of $0.04. Much worse than the average of $0.07. Now let's compare with what happens when a user lands on a page of an individual empanada product page. It's the same process as above except we use Landing Page Contains "empanada.html."
Create the "Empanada" Advanced Segment
1. Go to Advanced Segments>Create New.
2. Dimension: Landing Page
3. Contains "empanada.html"
4. Name it "Visits that land on empanada."
Yeah, that's nice but how do I do the same for my website?
The above is a great example of full circle analytics. Set up goals, then create the reports and segments you best need to analyze the success of the goals. We chose to look at Landing Pages, but after you have goals, reports and segments in place, you can do most analyses.
Website structure
 (click to enlarge)
Given this site design and our goal to sell as many empanadas as possible, let's look at this question:
Which type of landing page (home, category, or product) leads people to purchase more empanadas?
To answer it, we'll use two Google Analytics features, Custom Reports and Advanced Segments, to find out exactly, in dollars, which is the best type of page. And to perform this analysis we need one of two things: 1. e-commerce or 2. goals with a goal value.
Searching for the answer in Landing Pages
First go to the Content > Landing Pages.


(click to enlarge)
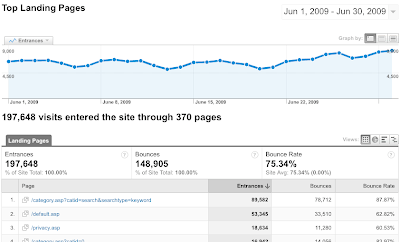
This report is naturally a good place to start but it only gives us three metrics: Entrances, Bounces and Bounce Rate. I want to know dollar amount, not bounce rate. To get the value of each landing page we have to create a custom report.
Step 1) Create the Custom Report
Go to Custom Reporting and create the following report:
Dimension: Landing Page
Metrics: Entrances, Abandonment Rate, Goal Completed and Value per visitor
 (click to enlarge)
Great. Now I know the average value for any visitor that starts on these pages. On average the value per landing pages is $0.07. This means for all people who arrive at my webpage, on average each person will buy $0.07 worth of empanadas. Not much huh? However, as you can see some pages have a consistently much better conversion rate than others. For example, my home page -- /home.html -- gives me a per visit value of $0.10. I'd like to compare that with my other two page types: product and categories. We could go through this list and pick out one by one which is better, or write a regular expression in the search filter box, but an easier and more flexible way to identify these page is via Advanced Segments.
Step 2) Create the Advanced Segment
Take a minute to think about the layout of your website. Is there a unique identifier that let's you segment your landing page types? If there isn't then ask your Webmaster what you can do to get around this problem. In our example, remember that our website is very simple. Every empanada page contains the word empanada.html, every category page contains category.html, and the home page is home.html. To begin with, let's create a category segment.
Create the "Category" Advanced Segment
1. Go to Advanced Segments>Create New.
2. Dimension: Landing Page
3. Contains "category.html"
4. Name it "Visits that land on Category."
5. Save and Apply to report
1. Go to Advanced Segments>Create New.
2. Dimension: Landing Page
3. Contains "category.html"
4. Name it "Visits that land on Category."
5. Save and Apply to report
Ouch! Visitors that land on my category pages spend an average of $0.04. Much worse than the average of $0.07. Now let's compare with what happens when a user lands on a page of an individual empanada product page. It's the same process as above except we use Landing Page Contains "empanada.html."
1. Go to Advanced Segments>Create New.
2. Dimension: Landing Page
3. Contains "empanada.html"
4. Name it "Visits that land on empanada."
5. Save and Apply to report
Here is what we get:


(click to enlarge)
Wow! Visits that see a product page before anything else spend $0.30 on average. That's over 7 times more than the value of the category landing pages. Which pages should we use? Our empanada pages of course! We no longer have to guess which page is best. Even if we have hundreds of different types of empanadas we can calculate to the penny the potential value of focusing our advertisements on products.Yeah, that's nice but how do I do the same for my website?
The above is a great example of full circle analytics. Set up goals, then create the reports and segments you best need to analyze the success of the goals. We chose to look at Landing Pages, but after you have goals, reports and segments in place, you can do most analyses.
Here are the key takeaways:
1. Most importantly your URLs must have a unique identifier (like our ?type=empanadas) so you can segment by page type AND either e-commerce implementation or a goal value.
2. Instead of thinking home, category, and product think home, broad, or specific. Usually, the more specific and focused the landing pages the better.
3. If you don't use an e-commerce website don't worry, you can do the same analysis. For e-commerce websites its much easier for us to calculate exact dollar return -- but! we can also use goal value to calculate user value. So, if you don't sell a product, your goal might be to have the users fill out a contact form. If for every 100 users that fill the form you can gain 5 leads that over a month spend an average of $100 each then the value of your form is 5x$100=$500/100=$5 per form completed. This goal value can also be used to calculate landing page value.
Now that you know exactly how to use Google Analytics to identify the value of your landing pages it's time to apply the lessons to your website. How much money do your landing pages bring you?