Announcing Data Studio: our free, new, Data Visualization Product
May 25th, 2016 | Published in Google Analytics
Earlier this year, as part of the Google Analytics 360 Suite announcement, we unveiled a new data visualization and reporting platform for large enterprises — Data Studio 360.
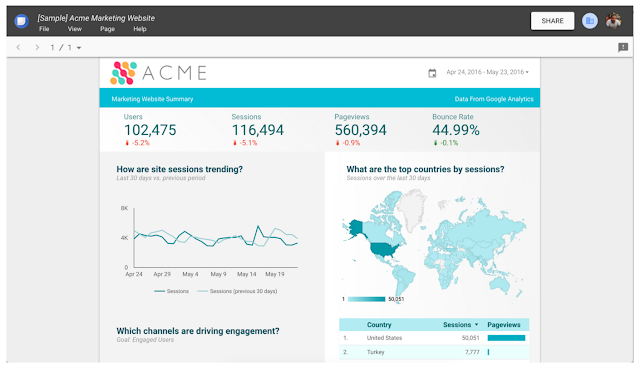
Yesterday, at the Google Performance Summit, we announced a free version of Data Studio for individuals and smaller teams. Data Studio lets you connect to all your marketing data and turn that data into beautiful, informative reports that are easy to understand, share, and fully customizable. We wanted to take a moment to give you some of the details about Data Studio.
Making it easy to share data within your organization — or with the world
One of the fundamental ideas behind Data Studio is that data should be easily accessible to anyone in an organization. We believe that as more people have access to data, better decisions will be made.
With multiple data connectors, you can now easily create dashboards from many different types of data and share with everyone in your organization - and you can mix and match data sources within a single report. For example, you can combine Google Analytics data and Google AdWords data into a single report.

Today, we’re offering multiple data connectors, so you can connect to Google Analytics, Google AdWords, Google Sheets and many other Google services. But Data Studio offers integration with a wide variety of data sources. There’s also a connector for BigQuery and we will soon have connectors to SQL databases that will let you access first party data.
Data Studio is more that just sharing reports with other people — it’s true collaboration. We used the same infrastructure as Google Docs, so you can edit reports together, in real time. This is useful as you combine data from multiple teams and need others to add analysis and context to the report.
Visualization tools to style your reports and data
In addition to new sharing and collaboration tools, Data Studio gives you many flexible ways to present your data. Sure, there’s the usual assortment of bar charts, pie charts, and time series. But we’ve also included some new visualizations — like bullet charts that help you communicate your progress towards a business goal.

Another advanced feature is the ability to create a heatmap using tabular data. This visualization makes it easy to instantly identify outliers within a table of data.

Data Studio also has an array of other features to help you customize how you present your data. There are a number stylistic tools that enable you to design your reports to represent your specific brand. There are also interactive data controls, like a date picker and dynamic filters, that enable report editors to make reports interactive for viewers.
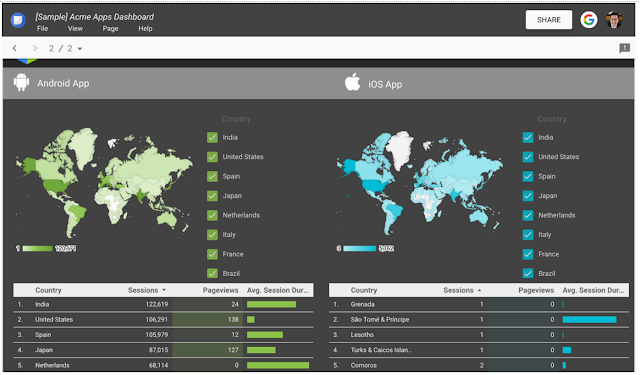
For example, let’s say you want to let users segment a report by country. Just add a control element to the top of your report and the user can dynamically segment the data. In the image below the check boxes will change the data in the map and data table based on what a user selects.

These are just a few of the tools that you can use to help others in your organization understand data.
Two versions for different types of organizations
The primary difference between Data Studio 360 and the free version, Data Studio, is the the number of reports you can create, which is five per account. Both versions support connecting to unlimited data sources and offer unlimited report viewing, editing and collaboration. For more information, check out our Help Center.
Getting started
If you’re ready to get started, watch this brief overview that will help you build your first reports.
Then check out the interactive walkthrough - it’s built with Data Studio. Just choose “Welcome to Data Studio (Start Here)” from the list of reports in your account.
Data Studio is currently available to users in the United States and we’ll be rolling it out to other geographic regions throughout the year. We hope it helps you share more data and make better business decisions.
Happy Dashboarding,
Posted by Nick Mihailovski & Nathan Moon, Data Studio team