One of the best things about working on web apps like Google Docs is that it gives us the flexibility to frequently bring you new features and improvements. Starting this month, we’re going to make some small changes to how we communicate what’s been happening in the world of Docs. Instead of writing blog posts for each and every minor update, we’re going to try bundling them together monthly to give you a detailed overview of our favorite features and a short list of other notable changes to make sure you don’t miss out on anything new.
On that note, we’ve got a bunch of new features that launched today, as well as some great things that improved over the month of January.
Customizable styles in documents
Giving your document consistent and beautiful formatting should be easy. Before today, if you wanted to update all the Subtitles in your document to look a particular way, you had to change each of them one at a time. That’s too many steps. Now you can restyle all your regular paragraphs, headings, or titles with just a couple clicks. For example, if you want to update all the Subtitles in your document to be a particular size, set one Subtitle to that size, select it, right click and choose Update Subtitle to match selection. This will change all the Subtitles already in your document and automatically update the style for any new Subtitles you create. Plus, with the new Options menu in the styles dropdown, you can set the current document’s styles as the default for new documents or you can load your default styles into the current document.
Sparklines in spreadsheets and more charting options
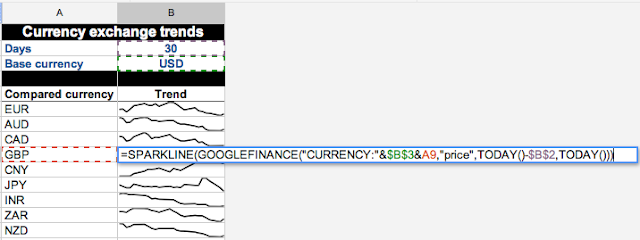
In Google spreadsheets, we’ve added more charting options and support for sparklines to make it easier to communicate data. The new options give you a bunch of tools to create more sophisticated charts including different Y-axes on either side of the chart, formatting options for the axis and title text, and all sorts of other customization for how your lines, bars, or pies are displayed. We’ve also added sparklines, which let you display line or bar charts inside of cells and are handy for presenting and comparing data in a simple, bite-sized way. In the example below, we’ve used sparklines to plot currency exchange rates over a 30-day period.
Sharing forms on Google+
Sharing the forms you create in Google Docs with the right people shouldn’t be a hassle. Today we added a Google+ share to the form editor so that you can share your forms directly with your circles with just a couple clicks.
And there’s more…
On top of today’s new features, here are some changes from January that you may have missed:
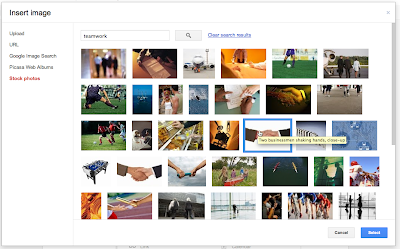
- Adding images to your docs from a high quality stock photo gallery. Simply go to Insert > Image, select Stock photos, and then search for the images that you want.
- A more streamlined format for document discussion notifications that batches multiple discussions into a single email.
- Quickly opening and selecting items from specific menus with keyboard accelerators. For example, when using Google Chrome, Ctrl+Option+E on a Mac and Alt+E on Windows or Linux will open the Edit menu.
- Copying and pasting via the context (right click) menu in documents when you have the Chrome App installed.
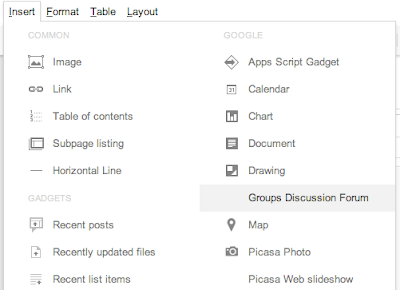
- Easily adding Google drawings or Google Groups discussions to a Google Site from the Insert menu.
- Progress bars while uploading files to Google Sites.
- Searching for text inside of PDFs in your documents list using Optical Character Recognition.
If you’d like to learn more about what we’ve been up to in January, I’ll be doing a Hangout On Air later this week this to talk about these changes and listen to your feedback. Stop by our Community Manager Teresa’s Google+ page on Thursday, February 9 at 12 p.m. EST to tune in.
Posted by: Jeff Harris, Product Manager
