At Google, we are passionate about speed and making the web faster, and from first hand experience, we are glad to see that many website owners share the same goal. A faster web is better for both users and businesses – faster pages lead to better user experience and improved conversions.
The first step in optimizing any process is to establish and obtain an accurate set of measurement data. In the context of optimizing the user experience on the web, it means that we need to measure the speed of a page as seen by your real users: users network, device type and speed, geographic location, cache sizes, and a dozen other factors all come into play.
Luckily, the
Site Speed reports in Google Analytics provide most of this data to us already. The new
Web Timing standard, which is already implemented by most modern browsers, allows Google Analytics to gather detailed latency data for a sample of requests across a dozen different dimensions. To see this data for your site, navigate to your Google Analytics account and look for the new “Site Speed” reports under the “Content” section – there is no additional instrumentation required on your behalf. This article describes the details about the speed metrics.
A frequently asked question we hear is:
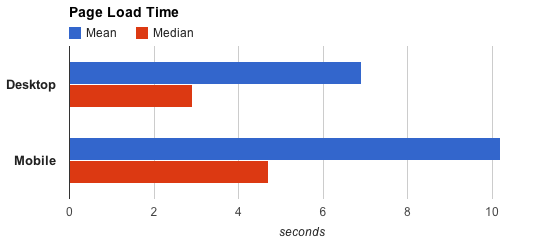
how do I know if my site is fast enough? The answer, of course, depends on the nature of the site, the content, and the type of interactions your users perform on the site. However, to help us establish a baseline, let us take a look at some aggregate speed data for the web as seen by Google Analytics and shared by opted-in web publishers:


Mobile internet is growing at an incredible rate and as we can see from the data above, mobile experience is about 1.5x slower than desktop experience. That’s a very big difference, and that is even taking into account that many popular sites are already optimizing for the mobile visitor: fewer resources, smaller resources, and smarter caching strategies.
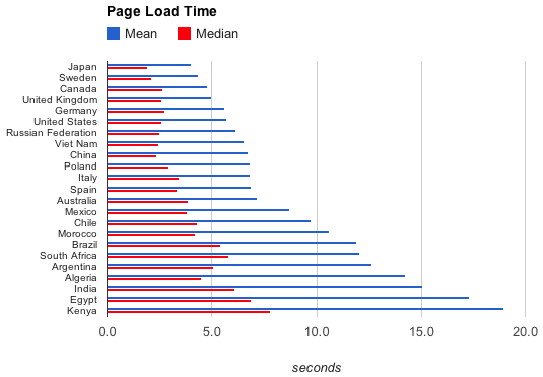
Let’s take a closer look at web performance for a few specific countries:

The following interactive world map presents the page load times for desktop in seconds for the complete list of countries with enough samples for accurate measurement:
The following map presents the corresponding data for mobile.
Note that there are many factors that play a role in overall speed of web pages as experienced by users. The browser, the network connection, the client hardware (processing power), the content of the web page, and the hosting location of the web site relative to the user all impact the speed of an individual page load. As a result, the country aggregates listed above depend on all those factors as well.
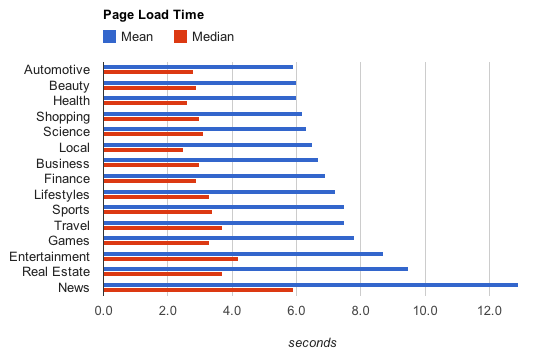
Finally, let’s take a look at relative page speeds across some of the popular verticals:

How does your site stack up?
Posted by Arvind Jain, Mustafa M. Tikir and Ilya Grigorik, Google Analytics team


